
EU's Carbon Footprint: Imports Exceed Domestic Emissions
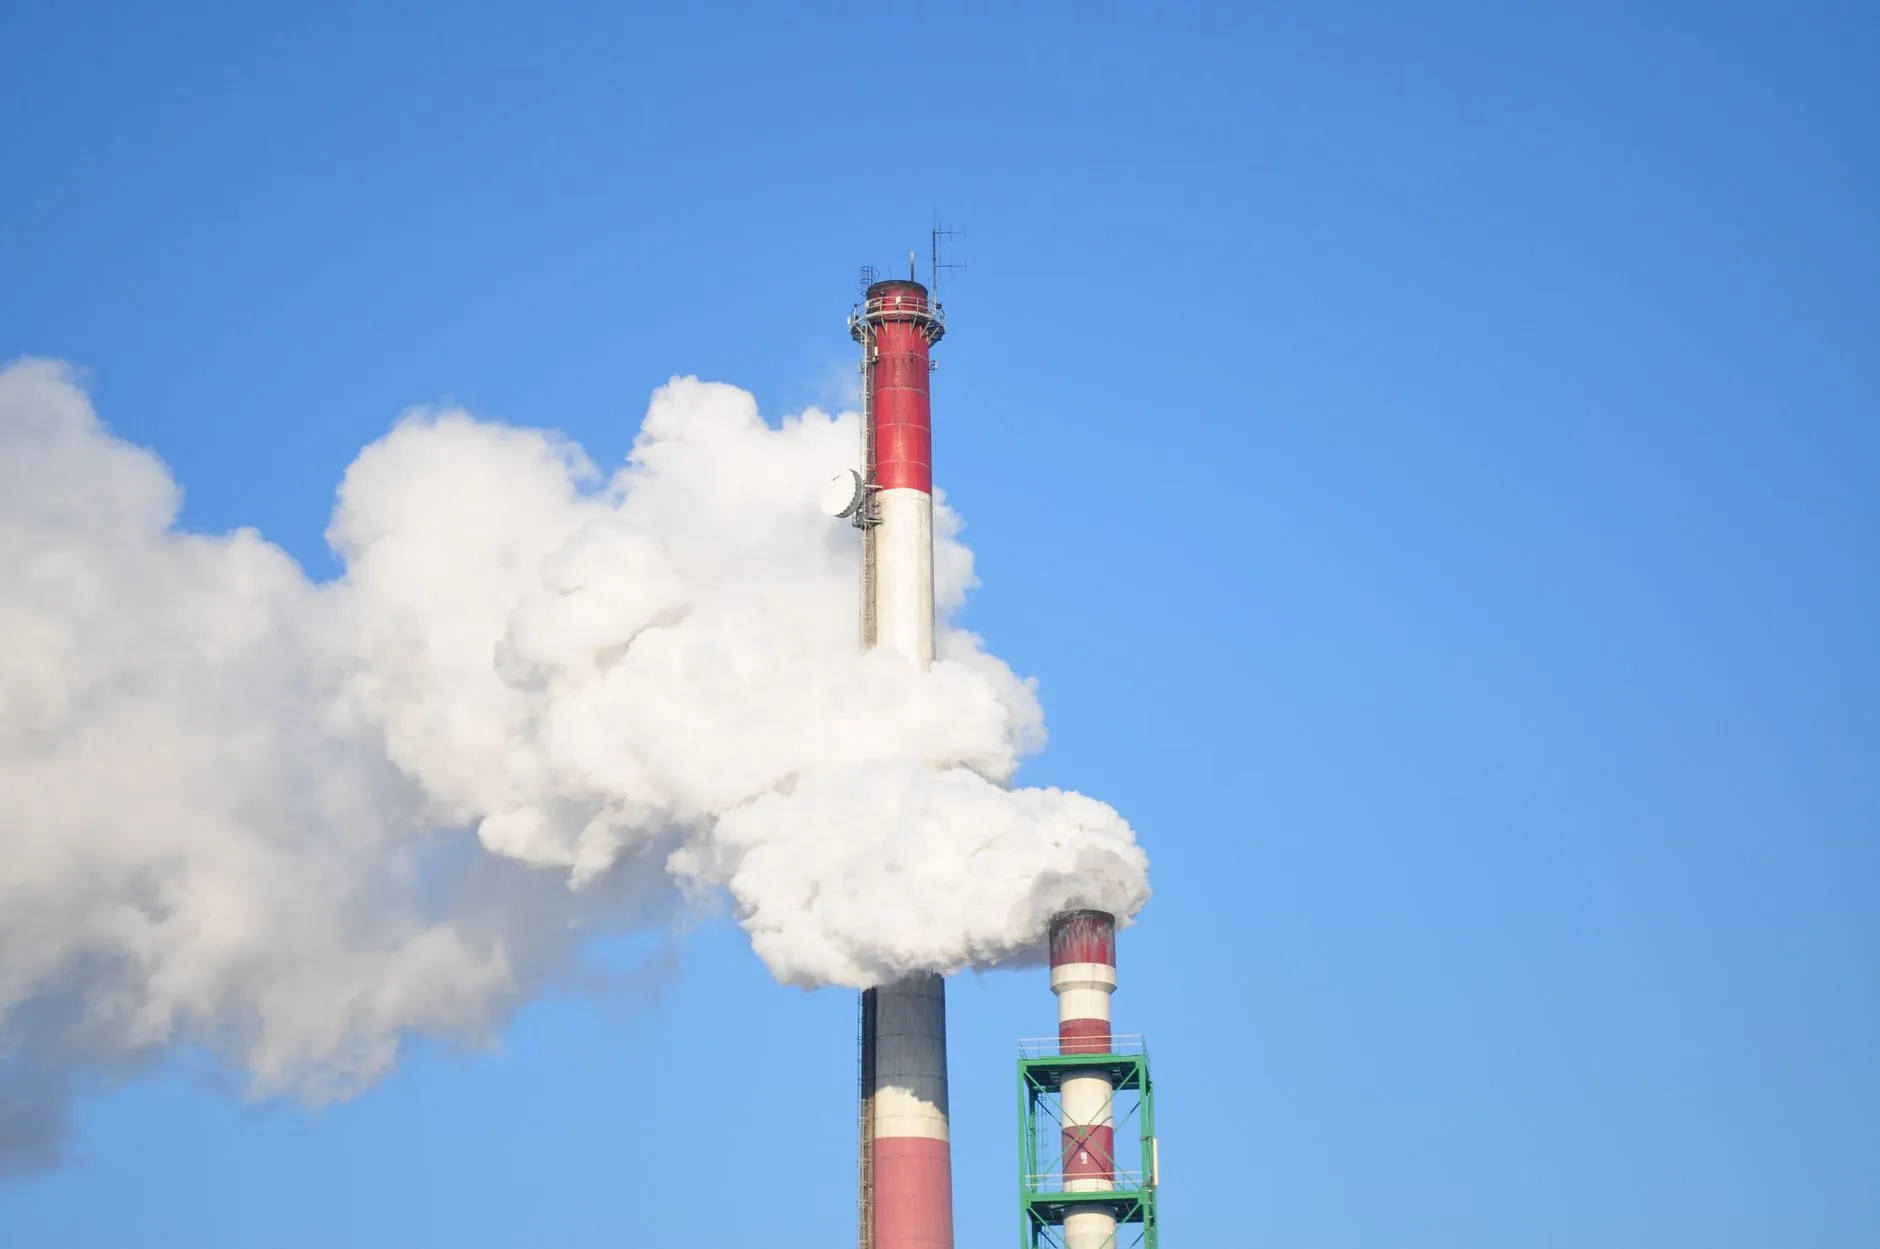
EU imported emissions now account for 35% of total carbon footprint
The EU's consumption footprint reached 4.0 billion tonnes of CO2e in 2023. Imported goods and services accounted for 1.4 billion tonnes of that total. Essentially, more than a third of the bloc's climate impact now originates outside its borders, according to Eurostat figures published in early 2025.
This matters because it reveals the gap between domestic climate progress and actual consumption patterns. While EU production-based emissions stood at 3.3 billion tonnes in 2023, the consumption footprint was 21% higher. The difference represents carbon embedded in supply chains that stretch across continents.
For UK businesses trading with the EU, this data reinforces a shift already underway. Brussels is no longer focused solely on cutting emissions at home. Instead, the Carbon Border Adjustment Mechanism and related policies now target embedded emissions in imports. That creates new compliance burdens for exporters and changes the risk profile for supply chain decisions.
How Eurostat measures consumption-based emissions
Eurostat's greenhouse gas footprint indicator tracks emissions across the full supply chain of goods and services consumed in the EU. This includes emissions embedded in imported products, regardless of where production occurred. The methodology differs fundamentally from traditional territorial accounting, which only counts emissions released within a country's borders.
The 2023 figure continues a pattern visible in recent years. In 2022, the EU's footprint was 3.6 billion tonnes of CO2e, with 1.9 billion tonnes originating outside the bloc. Consequently, the proportion of imported emissions has remained substantial even as domestic production emissions decline.
China represents the largest single external source linked to EU consumption among G20 countries. In 2023, Chinese production for EU markets generated 370 million tonnes of CO2e. That accounted for 26% of all extra-EU emissions associated with European consumption. Meanwhile, EU emissions linked to exports totalled 0.7 billion tonnes, or 21% of the bloc's production emissions.
This accounting approach captures a reality that territorial inventories miss. A manufacturer might report lower emissions domestically while relying on carbon-intensive components from overseas suppliers. The footprint indicator adds those upstream emissions back into the calculation, providing a fuller picture of consumption impact.
CBAM brings embedded emissions into trade policy
The Carbon Border Adjustment Mechanism sits at the centre of this issue. Under CBAM, importers of selected goods must report embedded emissions starting from October 2023. The regulation defines embedded emissions as direct emissions from production plus indirect emissions from electricity used in manufacturing.
Currently, CBAM covers cement, iron and steel, aluminium, fertilisers, electricity and hydrogen. The European Commission has published default values for embedded-emissions reporting during the transitional phase, which runs until the end of 2025. From January 2026, importers will need to purchase CBAM certificates corresponding to the carbon content of their goods.
This represents a significant change in how trade and climate policy intersect. Previously, EU climate rules applied mainly to domestic producers. Now, importers face parallel obligations. The stated aim is to prevent carbon leakage, where production shifts to regions with weaker climate rules. However, the practical effect is to extend EU carbon pricing beyond its borders through trade requirements.
For businesses exporting to the EU, CBAM creates new administrative and financial obligations. You need systems to calculate embedded emissions accurately, documentation to verify those calculations, and potentially higher costs if your production is carbon-intensive. Alternatively, you may face competitive disadvantage against suppliers with lower emissions or better reporting infrastructure.
What the 1.4 billion tonne figure reveals about supply chains
The scale of imported emissions underscores how deeply carbon is woven into global supply chains. At 1.4 billion tonnes, these emissions exceed the entire annual output of many industrialised nations. They originate from raw material extraction, component manufacturing, processing, and energy use across multiple countries before goods reach EU consumers.
This creates a policy challenge for the EU and a commercial challenge for suppliers. Brussels wants to reduce its consumption footprint without simply offshoring emissions to trading partners. Therefore, policies like CBAM attempt to create equivalent carbon costs for imports and domestic production. The risk for exporters is that carbon intensity becomes a competitive factor alongside price, quality and delivery terms.
Several factors drive the high proportion of imported emissions. Global supply chains have grown more complex over recent decades, with production stages distributed across multiple jurisdictions. Many manufactured goods now incorporate components from five or more countries before final assembly. Additionally, the EU has increasingly specialised in lower-emission service sectors while importing carbon-intensive materials and manufactured goods.
Energy sources also play a role. Production in countries relying heavily on coal-fired power generates higher embedded emissions than equivalent processes using renewable energy. Consequently, the same product manufactured in different locations can have vastly different carbon footprints. This variation explains why origin matters increasingly in EU procurement and why supply chain mapping has become a compliance issue.
Import emissions compared to domestic reductions
EU production-based emissions have declined significantly since 1990. However, consumption-based emissions tell a different story. While domestic emissions fall, imported emissions partly offset those gains. The 21% gap between production and consumption figures reveals this offset effect clearly.
From a policy perspective, this matters because it affects how the EU measures climate progress. If territorial emissions decline but consumption emissions remain stable or grow, the bloc's contribution to global emissions stays higher than national inventories suggest. Therefore, consumption-based accounting provides a more complete assessment of climate impact.
For businesses, the distinction between production and consumption emissions creates different incentives. Under traditional territorial accounting, reducing on-site emissions improves your carbon position. Under consumption-based accounting, the emissions embedded in purchased goods and services also count. This shifts attention toward supply chain decarbonisation and procurement decisions.
The footprint data also explains why Scope 3 emissions have become increasingly important in corporate reporting. Scope 3 covers indirect emissions in your value chain, both upstream and downstream. As regulators and investors focus more on consumption footprints, Scope 3 transparency becomes essential. Companies that cannot demonstrate supply chain emission reductions may face regulatory penalties or market disadvantage.
Key facts about EU consumption emissions in 2023
- The EU's total greenhouse gas footprint reached 4.0 billion tonnes of CO2e, representing all emissions associated with goods and services consumed within the bloc.
- Imported emissions accounted for 1.4 billion tonnes, or 35% of the total footprint, highlighting the significant role of global supply chains in European consumption patterns.
- EU production-based emissions stood at 3.3 billion tonnes, meaning the consumption footprint was 21% higher than territorial emissions reported in national inventories.
- China emerged as the largest external source of emissions linked to EU consumption, contributing 370 million tonnes of CO2e or 26% of all extra-EU emissions.
- EU emissions linked to exports totalled 0.7 billion tonnes, representing 21% of domestic production emissions and showing the bloc also produces for external markets.
- CBAM currently covers six sectors including cement, iron and steel, aluminium, fertilisers, electricity and hydrogen, with mandatory certificate purchases beginning in January 2026.
- The gap between consumption and production emissions demonstrates that territorial accounting alone cannot capture the full climate impact of modern economies with complex international supply chains.
Commercial implications for UK exporters and manufacturers
If you export to the EU, the consumption footprint data signals where policy is heading. Brussels now views embedded emissions as a legitimate target for climate regulation, not just an accounting curiosity. That creates compliance costs and competitive pressure based on carbon intensity.
CBAM represents the most immediate concern for affected sectors. From 2026, you will need to calculate embedded emissions for covered goods and purchase certificates to match the carbon content. The certificate price will track the EU Emissions Trading System, currently trading above €60 per tonne. Consequently, high-emission production methods will attract significant costs when exporting to Europe.
Beyond direct CBAM obligations, the trend toward consumption-based accounting affects procurement decisions throughout the supply chain. Large EU buyers increasingly request emission data from suppliers as part of their own Scope 3 reporting. Companies with robust carbon accounting gain an advantage in tenders and long-term contracts. Those without credible data face questions about their carbon intensity and may lose business to competitors with better transparency.
The 35% imported emissions figure also suggests that EU policies targeting consumption footprints will expand. CBAM currently covers six sectors, but the regulation includes provisions for extension to other product categories. Similarly, proposed EU rules on green claims and eco-design requirements will create additional compliance obligations based on embedded emissions and lifecycle impacts.
For manufacturers, this creates pressure to decarbonise both direct operations and supply chains. Switching to renewable energy reduces embedded emissions from electricity. Choosing lower-carbon materials and components reduces upstream emissions. Improving energy efficiency cuts emissions and operating costs simultaneously. These steps become commercially necessary as carbon intensity affects market access and competitive position.
How UK businesses should respond to consumption footprint trends
Start with accurate measurement. You cannot manage carbon intensity without reliable data on emissions across your value chain. For CBAM-covered goods, this means calculating direct process emissions and indirect emissions from purchased electricity. For broader supply chain management, it means mapping Scope 3 emissions from purchased goods and services.
Several tools and standards can help. The Greenhouse Gas Protocol provides internationally recognised methods for calculating emissions across all scopes. Our net-zero program for carbon reporting compliance helps SMEs develop emission inventories that meet regulatory requirements and provide decision-useful data. Industry-specific guidance exists for many sectors, offering calculation methods tailored to particular processes and materials.
Once you have baseline data, identify reduction opportunities. Energy switching often provides the quickest wins. Replacing fossil fuel use with renewable electricity or heat cuts emissions and may reduce costs depending on energy prices. Process improvements can reduce energy consumption and material waste simultaneously. Supplier engagement helps identify lower-carbon alternatives for purchased components and materials.
For EU exports, consider whether emission intensity creates competitive risk. If your production methods generate higher emissions than industry averages, CBAM costs will exceed those paid by lower-carbon competitors. That creates immediate financial pressure and may affect customer relationships if buyers face reputational or regulatory pressure over supply chain emissions.
Documentation matters as much as actual reductions. CBAM requires verifiable emission calculations, not estimates. EU procurement increasingly demands emission data backed by recognised standards. Therefore, robust carbon accounting systems become necessary infrastructure for EU market access. This may require investment in measurement equipment, data systems, and staff training.
Training and capacity building help embed carbon management into business operations. The SBS Academy offers training on Scope 3 emissions and supply chain carbon accounting. Understanding how embedded emissions flow through your value chain enables better procurement decisions and identifies where reduction efforts deliver the most value.
Where policy may head next
The consumption footprint data provides political cover for expanding carbon border measures beyond current CBAM sectors. If 35% of EU emissions originate from imports, Brussels can argue that climate policy must address consumption patterns, not just domestic production. Therefore, expect proposals to extend CBAM to additional product categories over the next few years.
Corporate sustainability reporting rules will likely tighten around Scope 3 emissions. The EU's Corporate Sustainability Reporting Directive already requires large companies to disclose supply chain emissions. As consumption-based accounting gains prominence, regulators may extend these requirements to smaller firms or impose stricter verification standards. Consequently, emission transparency may become a prerequisite for participating in major supply chains.
Public procurement represents another policy lever. If governments want to reduce consumption footprints, they can set maximum embedded emission thresholds for purchased goods and services. This approach already appears in some EU member states and could become more widespread. For suppliers, that means emission intensity affects eligibility for public contracts, not just private sector tenders.
Trade policy and climate policy will continue to merge. The EU views CBAM as compatible with World Trade Organization rules because it creates equivalent costs for imports and domestic production. Other jurisdictions may adopt similar mechanisms, creating a patchwork of carbon border requirements. Businesses trading internationally will need to navigate multiple carbon accounting regimes, each with different calculation methods and compliance processes.
Official resources on EU consumption emissions and CBAM
Eurostat publishes detailed statistics on the EU's greenhouse gas footprint, including breakdowns by source country and economic sector. The Eurostat statistics explained page on greenhouse gas emission footprints provides methodology notes and time series data showing how consumption emissions have evolved.
For CBAM obligations, the European Commission maintains dedicated guidance. The official CBAM information page includes transitional reporting requirements, default emission values, and timelines for full implementation. This resource updates regularly as the Commission publishes new technical guidance.
The CBAM regulation itself is available through EUR-Lex. Regulation (EU) 2023/956 sets out the legal framework, covered sectors, and calculation methods for embedded emissions. Reading the regulation provides clarity on exactly what data you must collect and how authorities will verify your submissions.
For UK businesses navigating these requirements, our ESG compliance and carbon reporting services help translate regulatory obligations into practical action. We work with SMEs to develop emission inventories, prepare CBAM submissions, and build carbon management into business planning.