
Shipping emissions cost nearly $1 trillion in economic damages
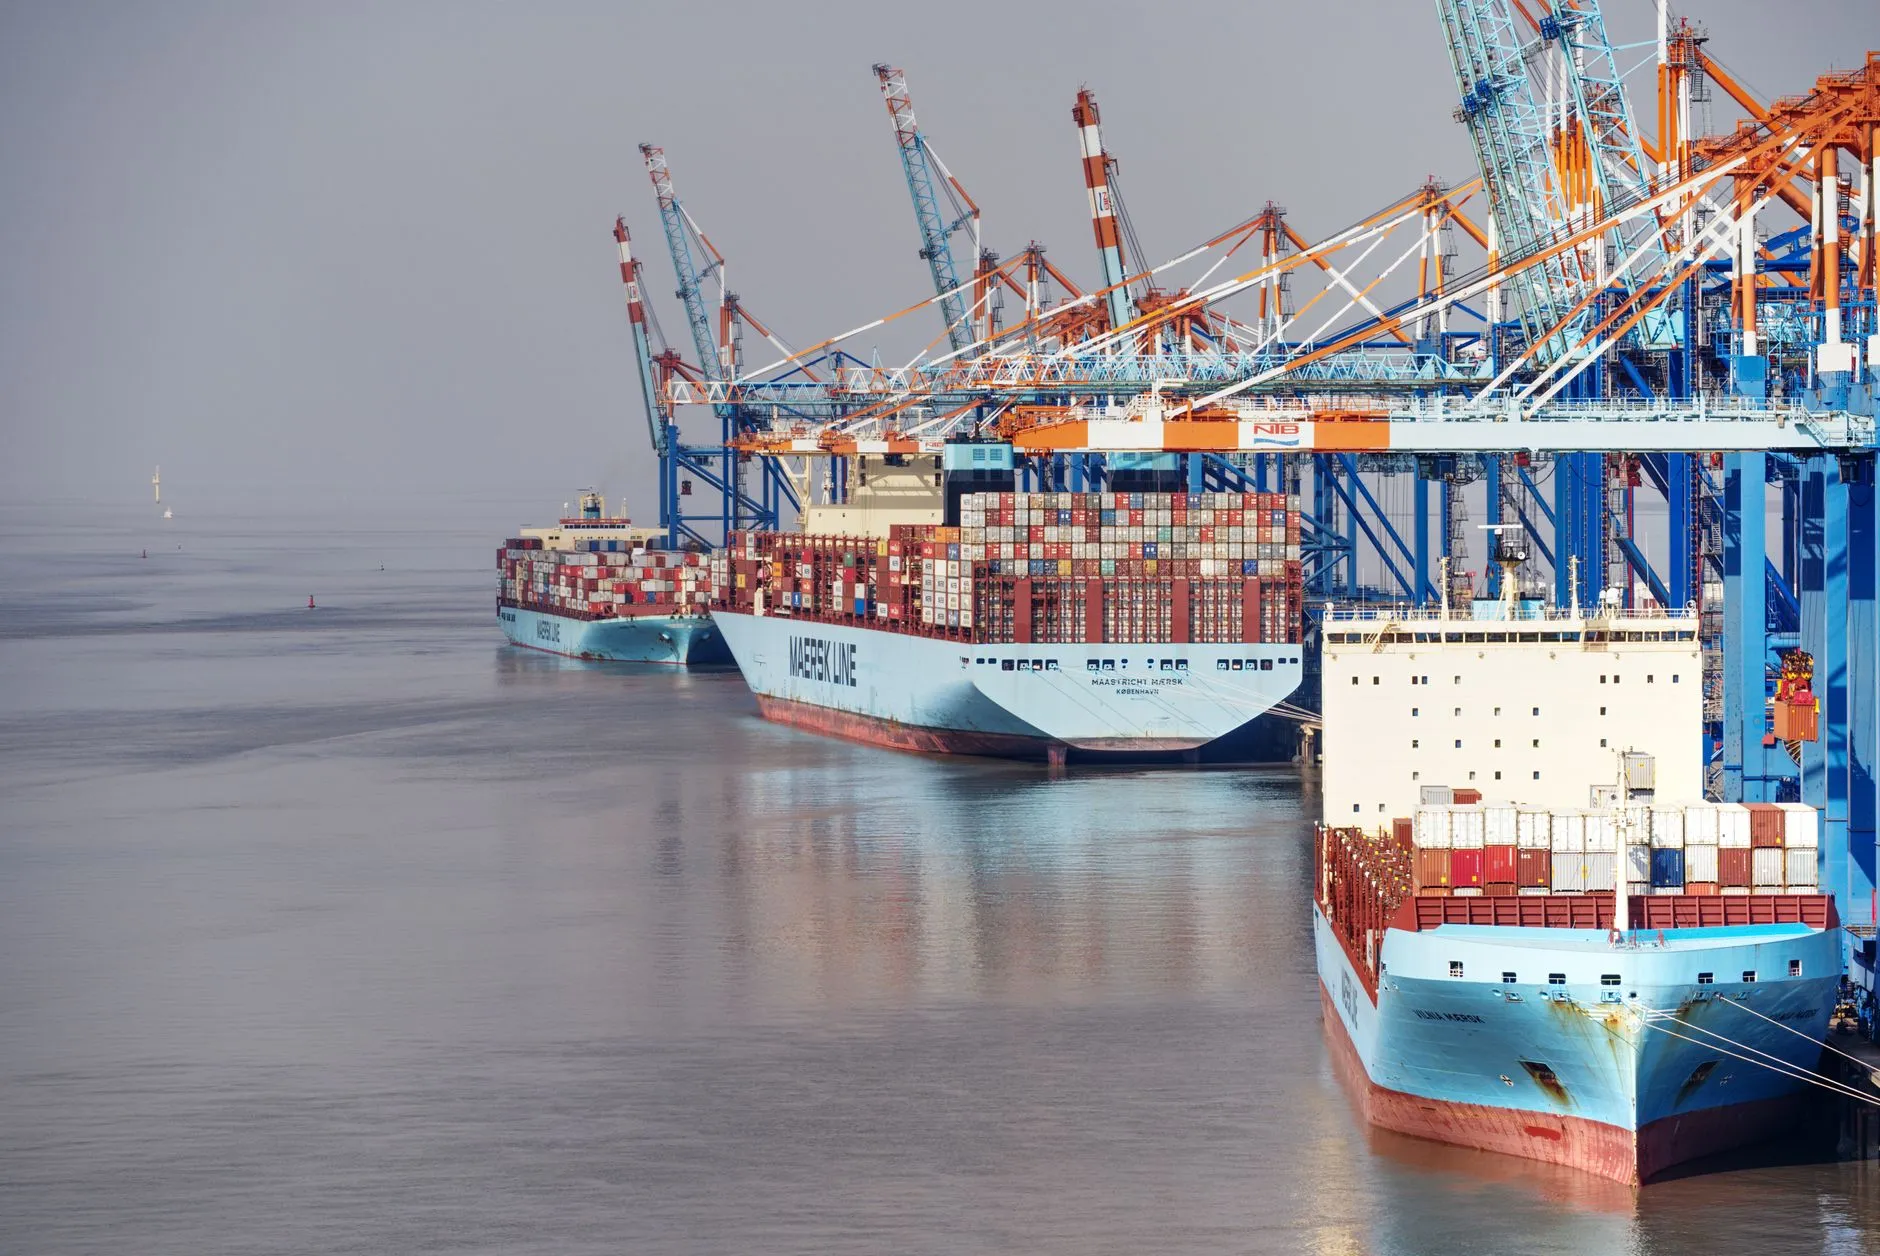
International shipping has left a substantial economic footprint over the past three decades. Emissions from the sector between 1990 and 2020 are estimated to have caused nearly $1 trillion in global economic damage, according to analysis by Zero Carbon Analytics. The figure represents the modelled cost of climate impacts linked to carbon dioxide released by ships during those 30 years.
For UK businesses that rely on maritime transport, the findings add weight to an argument already playing out in boardrooms and supply chain meetings. Shipping costs have long excluded the wider economic consequences of emissions. Those costs are now becoming visible through regulation, carbon pricing proposals, and pressure from buyers who need to account for transport emissions in their own net zero plans.
The analysis also reveals a sharp divide in how climate damage falls across countries. Large economies face the biggest losses in absolute terms. However, when measured against national output, the heaviest burden lands on smaller and middle-income nations. That imbalance matters for businesses operating international supply chains, particularly those exposed to climate risk in vulnerable markets.
Carbon emissions from shipping totalled 19 billion tonnes
Zero Carbon Analytics based its work on approximately 19 billion tonnes of CO₂ emitted by international shipping between 1990 and 2020. The emissions data came from successive greenhouse gas studies published by the International Maritime Organization. Researchers then applied a climate damage model developed at Stanford University to estimate the economic impact of those emissions.
The model traces a sequence of effects. Shipping emissions increase atmospheric carbon dioxide concentrations. Additional CO₂ contributes to rising global temperatures. Higher temperatures reduce economic growth and national income. Finally, those growth effects are converted into monetary terms using a 2% discount rate to calculate present value.
This approach produces a modelled estimate rather than a direct tally of losses. It does not count destroyed infrastructure, crop failures, or individual insurance claims. Instead, it estimates how much smaller national economies became as a result of temperature increases attributable to shipping emissions. Climate Action Tracker notes that historical shipping emissions data carries uncertainty because monitoring and reporting have not been consistent over the full period.
Nevertheless, the $962.7 billion figure offers a way to frame the economic consequences of maritime transport that have previously remained outside conventional cost accounting. For businesses, it highlights the gap between what they pay for freight and what society pays for the emissions that freight generates.
United States, China and Japan face largest absolute losses
The United States is estimated to have experienced the largest economic impact, with modelled damages of $280.7 billion. China follows at $113.5 billion, then Japan at $66.8 billion. India and Brazil round out the top five, with estimated losses of $49.2 billion and $31.1 billion respectively.
These figures reflect each country's share of global climate-related economic damage allocated to shipping's contribution. They should not be read as losses caused only by ships operating in national waters. The attribution is modelled, not directly observed.
The picture shifts considerably when damages are measured as a proportion of economic output. Zero Carbon Analytics estimates that shipping-related climate damage reduced 2020 GDP by 0.35% in the United Arab Emirates, 0.34% in Saudi Arabia, 0.32% in Mali, and 0.30% in Burkina Faso. These are markedly higher proportional impacts than those experienced by larger economies.
The contrast matters commercially. Large economies can absorb substantial nominal losses without severe disruption to overall activity. Smaller or more climate-vulnerable economies may suffer lower dollar losses but face more significant reductions in national output. For UK manufacturers and retailers sourcing from these regions, the implications include supply chain instability, higher operating costs, and potential disruption to trade routes.
Sector accounts for 2% of global CO₂ but broader pollution footprint
International shipping currently accounts for approximately 2% of global carbon dioxide emissions. However, the sector also releases pollutants beyond CO₂, including sulfur oxides, nitrogen oxides, particulate matter and volatile organic compounds. In 2018, shipping emissions represented roughly 9.2% of global sulfur oxide emissions, 16.8% of nitrogen oxides, and 4% of fine particulate matter, according to a review of the sector's environmental impacts.
These pollutants have direct health and environmental consequences, particularly near ports and coastal populations. Some ship-related aerosols temporarily cool the atmosphere by reflecting sunlight or altering cloud formation. That cooling effect does not offset long-term warming from greenhouse gases and adds complexity to any full assessment of shipping's climate impact.
For businesses, the takeaway is straightforward. Shipping emissions extend beyond carbon accounting. Companies subject to environmental reporting requirements need to consider the full range of pollutants when assessing their freight choices, particularly if they operate near port areas or supply customers with strict environmental standards.
IMO targets net zero by 2050 with fuel standards and pricing
The International Maritime Organization's member states have agreed that international shipping should reach net zero greenhouse gas emissions by or around 2050. That target aligns with the Paris Agreement goals and sets the framework for regulatory measures now under development.
The IMO's proposed Net Zero Framework includes a global fuel standard and an emissions pricing mechanism. Zero Carbon Analytics modelled a pathway resembling that framework and estimated it could avoid approximately 14.2 billion tonnes of CO₂-equivalent emissions between 2026 and 2050, compared with business as usual. The same analysis reported that the pathway could help prevent approximately 1.5 million heat-related deaths by 2100.
These projections are scenario-based. They depend on how quickly measures are implemented, which fuels the sector adopts, how effectively regulators enforce standards, and the broader trajectory of global emissions. An IMO comprehensive impact assessment published in 2024 estimated aggregate shipping-related costs of approximately $13.78 trillion between 2023 and 2050 under a policy scenario, compared with $9.62 trillion under business as usual.
Those figures represent system-wide modelled costs for the transition and are not directly comparable with the historical climate damage estimate. The former concerns future transition and operating costs. The latter estimates past economic damages associated with emissions already released. However, both underline the financial scale of maritime decarbonisation and the costs of inaction.
What UK businesses should understand about shipping emissions
- International shipping emitted approximately 19 billion tonnes of CO₂ between 1990 and 2020, with modelled economic damages estimated at $962.7 billion globally.
- The United States, China and Japan face the largest absolute losses, while smaller economies including the UAE, Saudi Arabia, Mali and Burkina Faso experience the highest proportional impacts relative to GDP.
- The sector currently accounts for around 2% of global CO₂ emissions and also releases significant quantities of sulfur oxides, nitrogen oxides and particulate matter.
- The IMO has committed to net zero emissions by or around 2050, with proposals including a global fuel standard and emissions pricing mechanism.
- Modelled pathways suggest the IMO framework could avoid 14.2 billion tonnes of CO₂-equivalent emissions and 1.5 million heat-related deaths by 2100, though these estimates depend on implementation pace and fuel choices.
- System-wide costs for maritime decarbonisation are estimated at $13.78 trillion between 2023 and 2050 under policy scenarios, compared with $9.62 trillion under business as usual.
Commercial implications for supply chains and compliance
The analysis adds an economic dimension to decisions UK businesses face over maritime transport. Shipping is essential to global commerce and carries most internationally traded goods. However, many of its climate costs have historically been externalised. They appear as reduced economic output, health impacts and environmental damage rather than in freight prices or fuel costs.
That gap is closing. Businesses that depend on international supply chains should expect freight costs to rise as the sector adopts cleaner fuels, invests in new vessels, and complies with emissions pricing mechanisms. These increases will not be uniform. Routes, fuel choices, vessel efficiency and port infrastructure will all affect the final cost.
Companies tendering for public sector contracts already need to demonstrate carbon reduction plans under Procurement Policy Note 06/21. Our net zero program for carbon reporting compliance supports businesses in meeting these requirements. Scope 3 emissions from freight and logistics are often a significant component of total reported emissions. Consequently, businesses need accurate data on shipping emissions to meet reporting standards and tender criteria.
The uneven distribution of climate damage also creates supply chain risk. Economies that suffer disproportionate climate impacts may experience instability, higher operating costs, or disruption to production and trade. UK businesses sourcing from climate-vulnerable regions should assess how climate damage might affect supplier reliability, regulatory environments, and long-term market access.
Moreover, the findings challenge cost-benefit assessments that compare decarbonisation only with the immediate expense of cleaner fuels and infrastructure. Including avoided climate damage could materially change the business case for measures such as fuel standards, efficiency requirements, and investment in zero-emission fuels. Businesses that move early may gain competitive advantage as buyers increasingly favour low-carbon supply chains.
Decarbonisation pathways and fuel transition risks
The maritime sector faces a challenging transition. Ships have long operational lives, often exceeding 25 years. Consequently, vessels ordered today will still be operating in 2050. Fuel infrastructure is global and heavily standardised around heavy fuel oil and marine diesel. Switching to zero-emission fuels requires coordinated investment across shipbuilders, fuel suppliers, port operators and regulators.
Several fuel pathways are under consideration, including ammonia, methanol, hydrogen and biofuels. Each carries different technical, safety and cost profiles. No single solution has yet emerged as the clear standard. For businesses, this creates uncertainty over future freight costs and the availability of low-emission shipping options.
In addition, the speed of the transition will vary by route and vessel type. Short-sea shipping and container vessels may adopt new fuels faster than bulk carriers or tankers. Therefore, businesses should expect a prolonged period of mixed fuel use, variable emissions intensity, and fragmented data quality.
Businesses that need to report Scope 3 emissions should engage with freight forwarders and carriers to understand their decarbonisation plans. Reliable emissions data will become increasingly important as reporting standards tighten and buyers demand verified carbon footprints. Our ESG compliance and carbon reporting services help businesses navigate these requirements and ensure supply chain emissions are accurately measured and reported.
Interpreting the $962.7 billion estimate
The $962.7 billion figure should be treated as an estimate rather than a precise bill. It depends on the selected emissions dataset, climate damage function, discount rate, and assumptions about how global warming affects economic growth. The country allocations are especially important to interpret cautiously because they represent modelled attribution, not direct observation of where shipping emissions physically caused damage.
Nevertheless, the broader conclusion is less dependent on any single number. Continued shipping emissions impose economic costs that extend well beyond the maritime sector. Those costs are distributed unequally, with vulnerable economies bearing a disproportionate burden. Rapid emissions reductions could therefore deliver benefits not only through lower atmospheric pollution and climate risk, but also by reducing the hidden economic burden currently shifted onto smaller economies and future generations.
For UK businesses, the key message is practical. Freight decisions have climate and economic consequences that are starting to appear in regulations, prices and buyer expectations. Companies that understand these dynamics and plan accordingly will be better positioned to manage costs, meet compliance requirements, and secure contracts that increasingly depend on demonstrated carbon performance.
Further information and guidance
The International Maritime Organization publishes regulatory updates and greenhouse gas studies on maritime emissions. The UK Department for Transport provides policy guidance on domestic maritime decarbonisation and the UK's position on international shipping emissions.
Businesses looking for detailed emissions factors for freight transport can consult the UK government's greenhouse gas reporting conversion factors, published annually. The Climate Action Tracker offers independent analysis of shipping emissions pathways and policy scenarios.
For tailored support on carbon reporting, Scope 3 emissions, and supply chain decarbonisation, our sustainable procurement support helps businesses assess freight choices and integrate emissions data into broader net zero strategies. Training on emissions reporting and climate risk is available through the SBS Academy.